Welcome to Sex Differences in Cancer web
Sex differences analysis and visualization
This web tools is aim to find the influence of sex-bias factors on cancer and find possible molecular mechanisms through the integration of multiple database information.
Survival and phenotype
Showing gender differences in prognosis in each type of cancer. Four endpoint events, which OS, DSS, DFI and PFI, are available. The population can be also stratified according to the age of diagnosis.
Molecular differences
RNA and miRNA expression profile was adjusted by tumor purity and propensity score matching (PSM), and was ploted. Somatic mutation and copy number variations differences were showed in different levels including tumor burden.DNA methylation profile was also grouped and compared by sex.
Signatures and pathways
Tumor-related signatures and pathways were collected and analyzed. Several methods were used to calculate immune infiltration.
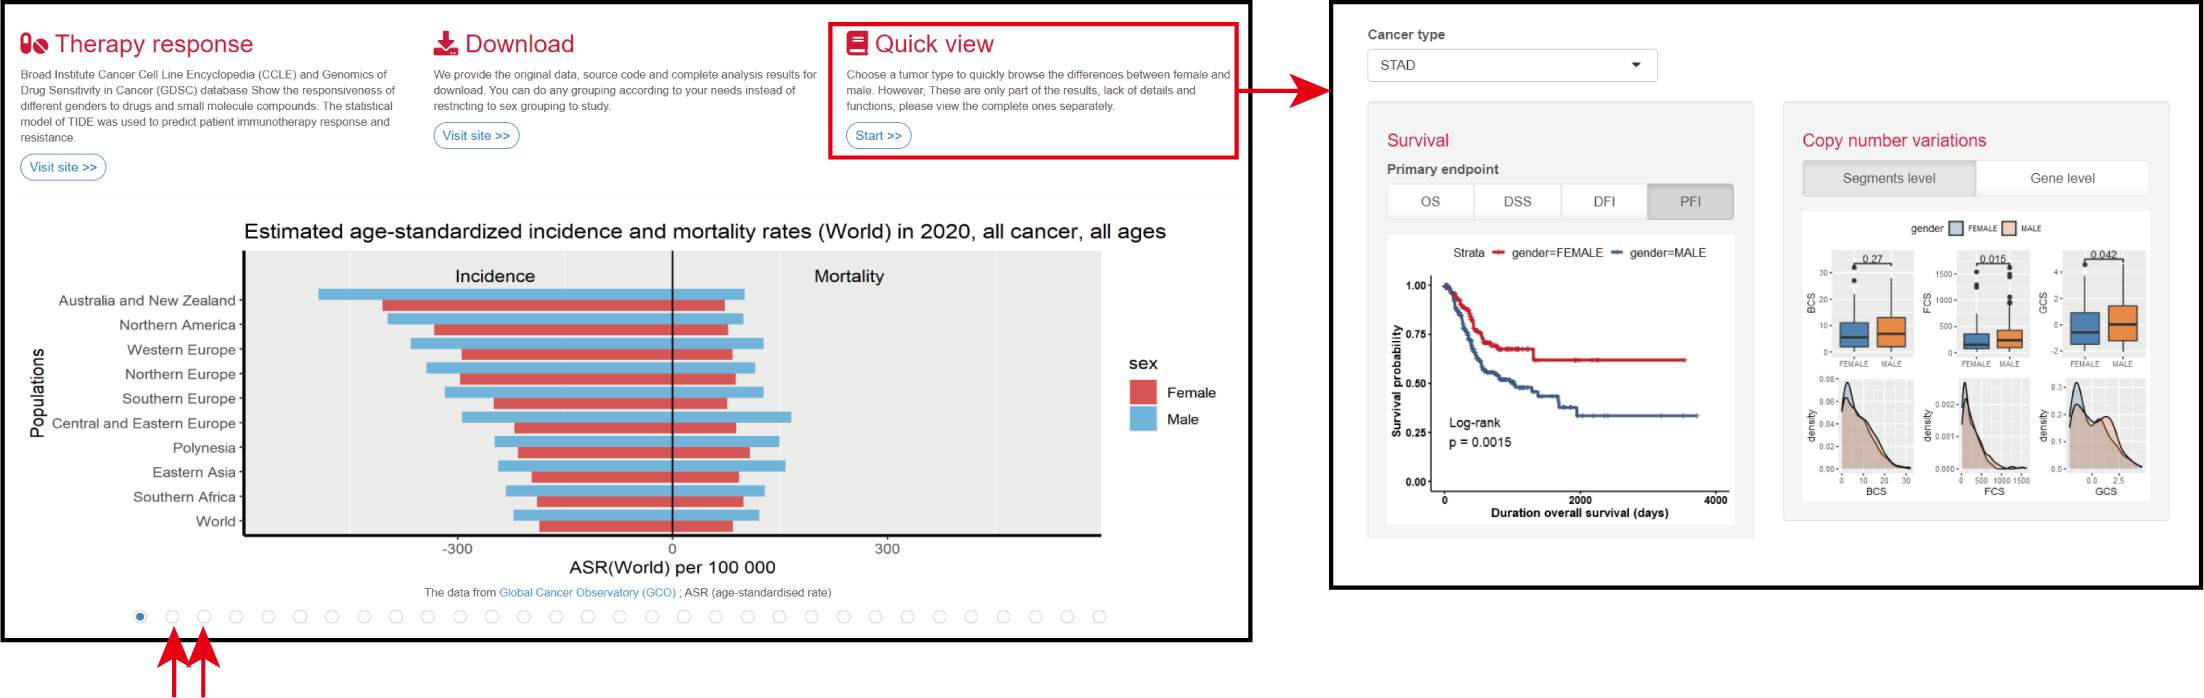
Therapy response
CCLE and GDSC database were used to calculate the responsiveness of cell lines of different sex origin to compounds. The statistical model of TIDE was used to predict patient immunotherapy response and resistance.
Download
We provide the original data, source code and complete analysis results for download. You can do any grouping according to your needs instead of restricting to sex grouping to study.
Quick view
Choose a tumor type to quickly browse the differences between female and male. However, These are only part of the results, lack of details and functions, please view the complete ones separately.
The data from Global Cancer Observatory (GCO) ; ASR (age-standardised rate)
Survival analysis
Molecular subtypes
RNA
miRNA
DNA methylation
Somatic mutation (SNV and INDEL)
Copy number variations
Tumor microenvironment
Signatures
Pathways
Chemotherapy response
Immunotherapy response
| Describtion | Link | Format |
|---|---|---|
| 1. Tumor purity in all tissues. | Download | R binary file (.rds) |
| 2. The compilation of TCGA molecular subtypes. | Download | R binary file (.rds) |
| 3. The results of mRNA differences between female and male. | Download | R binary file (.rds) |
| 4. The results of miRNA differences between female and male. | Download | R binary file (.rds) |
| 5. The results of DNA methlylation. | Download | R binary file (.rds) |
| 6. The results of somatic mutation differences between female and male. | Download | R binary file (.rds) |
| 7. The results of CNV gene level differences between female and male. | Download | R binary file (.rds) |
| 8. The results of CNV burdens differences between female and male. | Download | R binary file (.rds) |
| 9. The results of CNV region profile | Download | R binary file (.rds) |
| 10. The results of tumor microenvironment (TME). | Download | R binary file (.rds) |
| 11. The results of tumor signatures. | Download | R binary file (.rds) |
| 12. The results of drug response. | Download | R binary file (.rds) |
| 13. The results of immunotherapy response. | Download | TXT |
Phenotype
- TCGA TARGET GTEX selected phenotypes (n=19,131) UCSC Toil RNA-seq Recompute
- Curated clinical data (n=12,591) Pan-Cancer Atlas Hub
- Molecular subtype (n=7734)
Gene expression RNAseq
miRNA gene quantification
DNA methylation
Somatic mutation (SNP and INDEL)
Copy number
Pathway
Immunotherapy response
Drug sensitivity
TCGA Study Abbreviations
| Study Abbreviation | Study Name |
|---|---|
| LAML | Acute Myeloid Leukemia |
| ACC | Adrenocortical carcinoma |
| BLCA | Bladder Urothelial Carcinoma |
| LGG | Brain Lower Grade Glioma |
| BRCA | Breast invasive carcinoma |
| CESC | Cervical squamous cell carcinoma and endocervical adenocarcinoma |
| CHOL | Cholangiocarcinoma |
| LCML | Chronic Myelogenous Leukemia |
| COAD | Colon adenocarcinoma |
| CNTL | Controls |
| ESCA | Esophageal carcinoma |
| FPPP | FFPE Pilot Phase II |
| GBM | Glioblastoma multiforme |
| HNSC | Head and Neck squamous cell carcinoma |
| KICH | Kidney Chromophobe |
| KIRC | Kidney renal clear cell carcinoma |
| KIRP | Kidney renal papillary cell carcinoma |
| LIHC | Liver hepatocellular carcinoma |
| LUAD | Lung adenocarcinoma |
| LUSC | Lung squamous cell carcinoma |
| DLBC | Lymphoid Neoplasm Diffuse Large B-cell Lymphoma |
| MESO | Mesothelioma |
| MISC | Miscellaneous |
| OV | Ovarian serous cystadenocarcinoma |
| PAAD | Pancreatic adenocarcinoma |
| PCPG | Pheochromocytoma and Paraganglioma |
| PRAD | Prostate adenocarcinoma |
| READ | Rectum adenocarcinoma |
| SARC | Sarcoma |
| SKCM | Skin Cutaneous Melanoma |
| STAD | Stomach adenocarcinoma |
| TGCT | Testicular Germ Cell Tumors |
| THYM | Thymoma |
| THCA | Thyroid carcinoma |
| UCS | Uterine Carcinosarcoma |
| UCEC | Uterine Corpus Endometrial Carcinoma |
| UVM | Uveal Melanoma |
Home module
1. The home page provides a module description and a quick jump.
2. The global multi-cancer morbidity and mortality histogram is displayed at the bottom of the page, providing a quick and intuitive view of gender differences.
3. The Quick View function allows you to quickly select 1 of 27 tumor types for preview.
Survival and phenotype
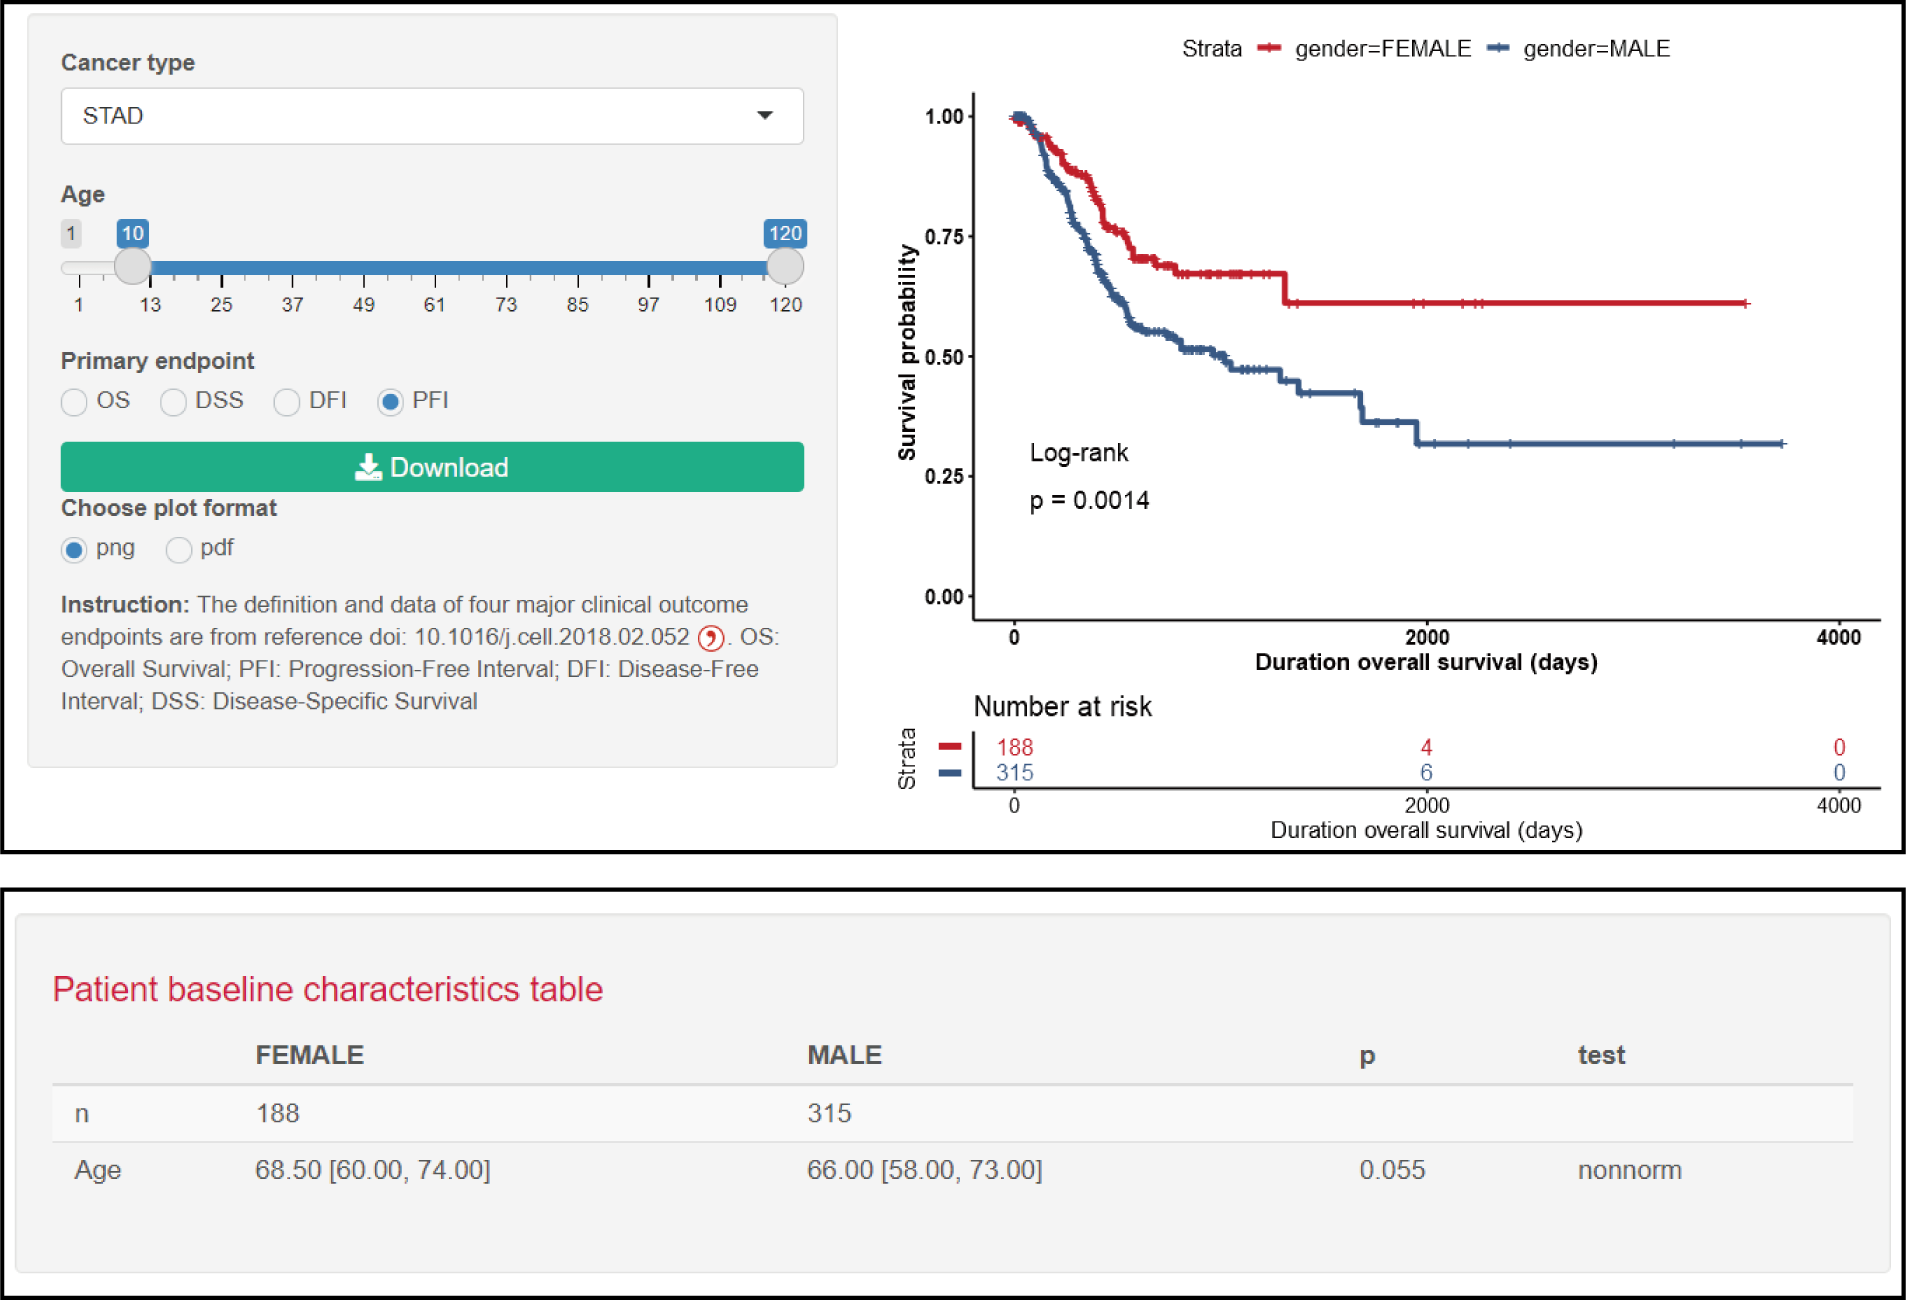
Parameters
Age: Filter age group.
Primary endpoints: Select different events as the endpoints.
Plot format: Select a picture download format.
Result
Kaplan Meier curve is shown with the log-rank p value, and the clinical baseline characteristics is displayed in the table.
Molecular differences
mRNA
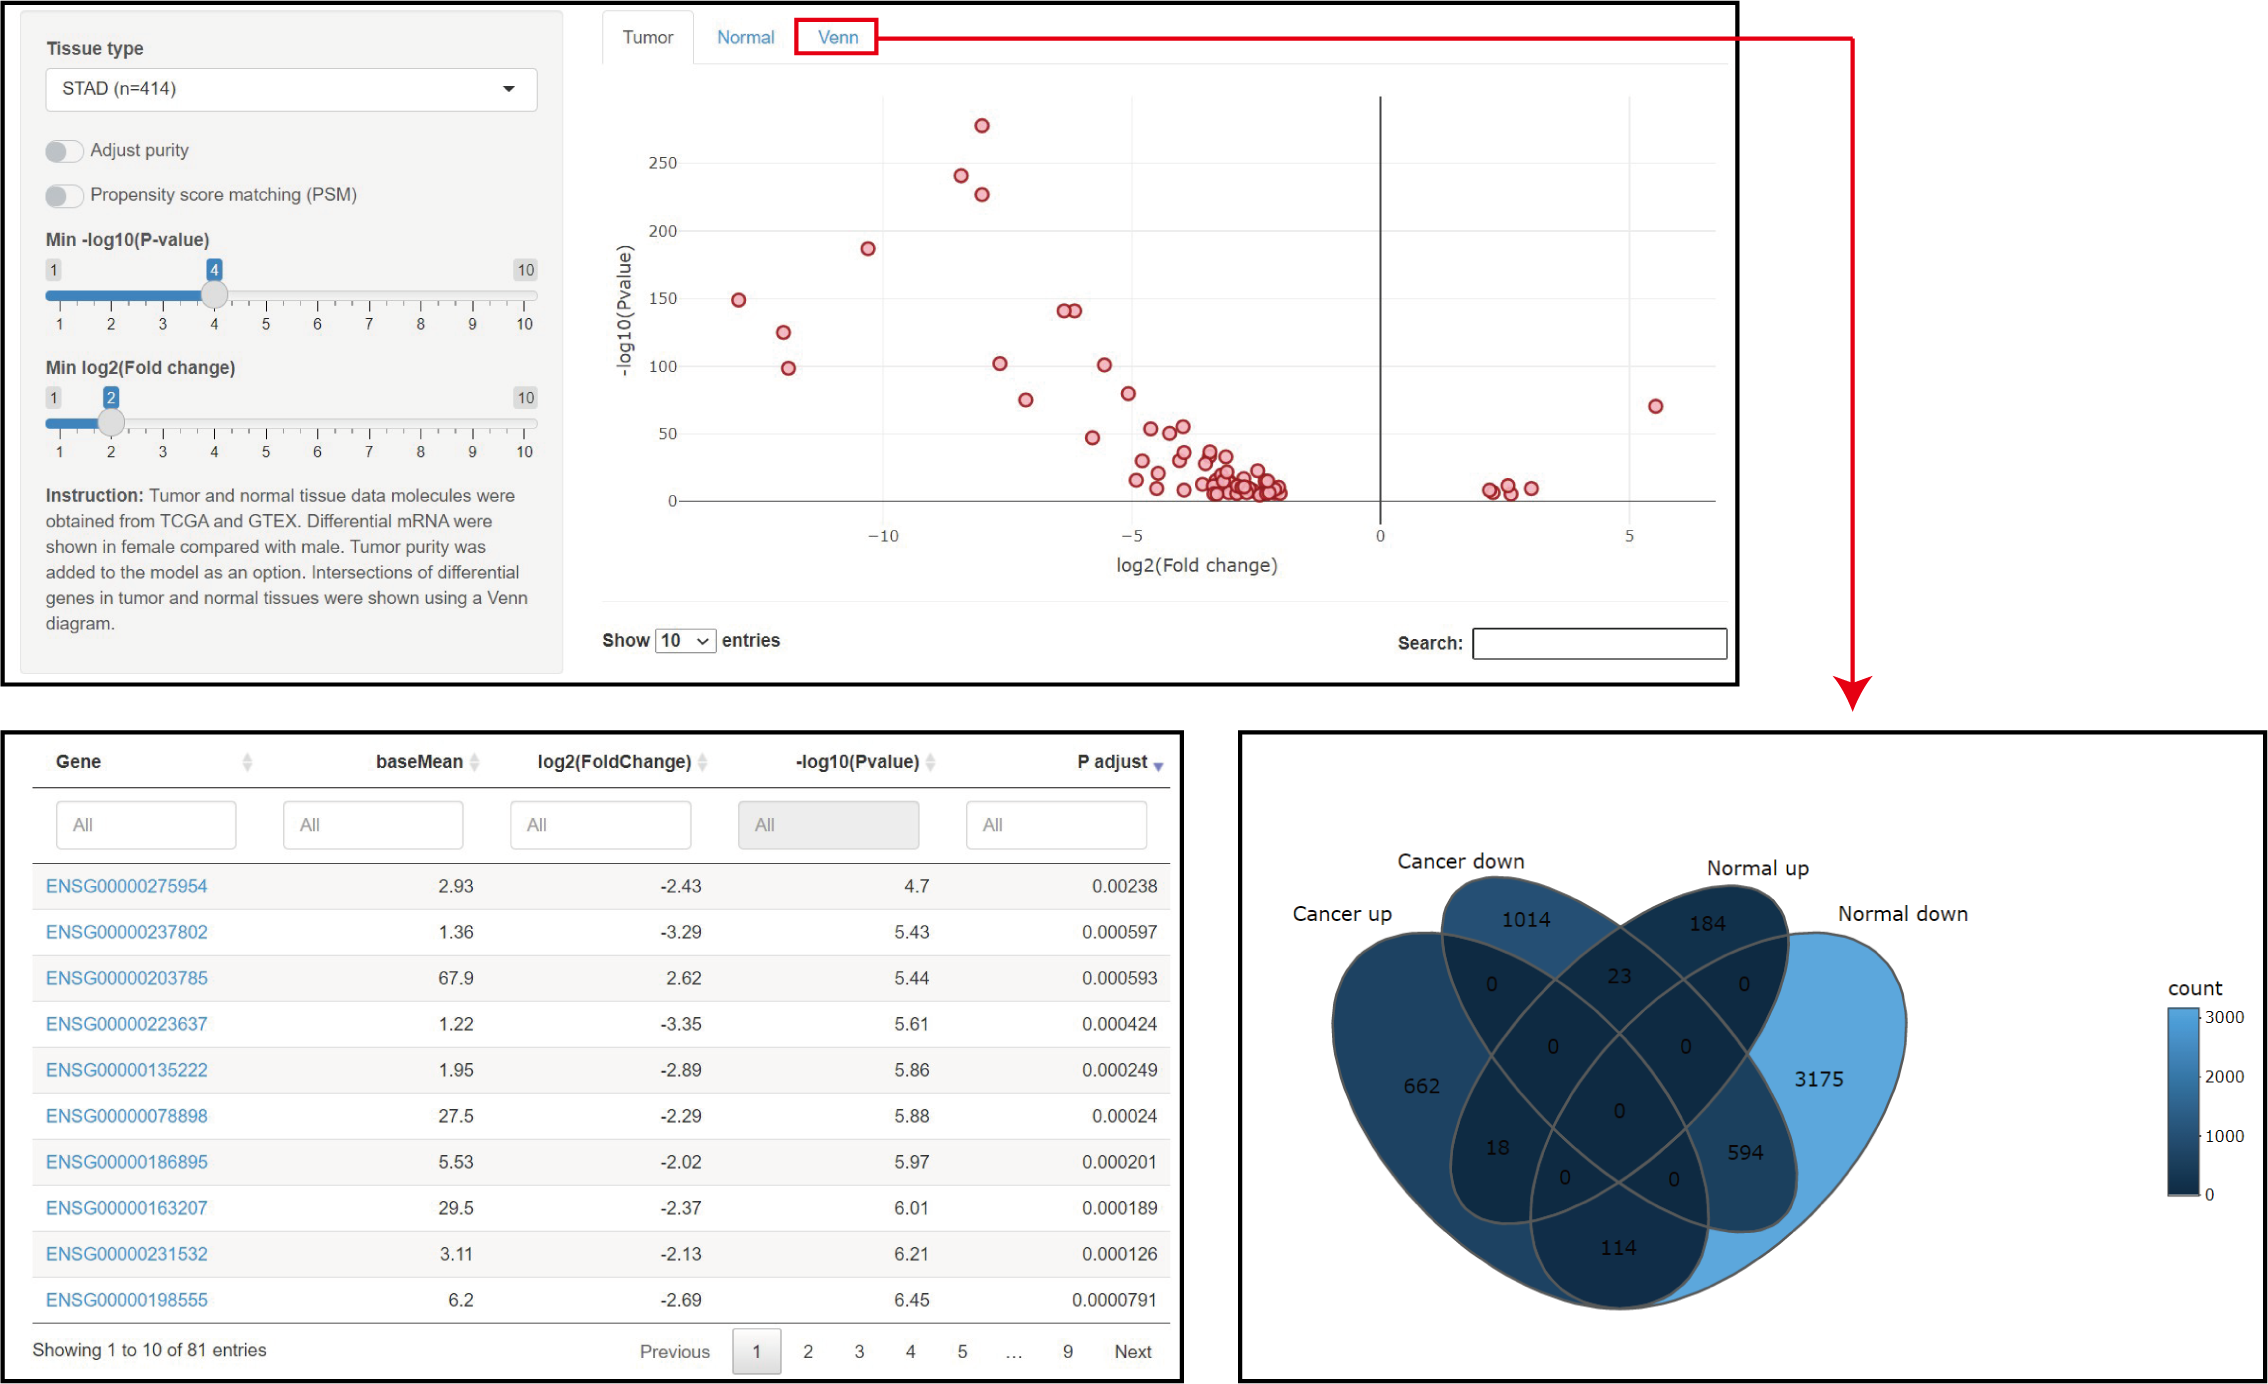
Parameters
Tissue type: TCGA code can been selcet.
Adjust purtity: Tumor purity was caculated and add to the model.
Min -log10(P value): Use the P value to filter the results.
Min log2(Fold change): Use the Fold change to filter the results.
Result
1. The results of the differences in RNA expression are shown as a volcano plot, and the gene symbol can be viewed by clicking on points in the plot.
2. More detailed information is shown in the table below, and more comprehensive information can be viewed by clicking on the link.
3. Intersections of differential mRNA between tumor and normal tissue are shown as a Venn plot, and can been downloaded as CSV.
miRNA
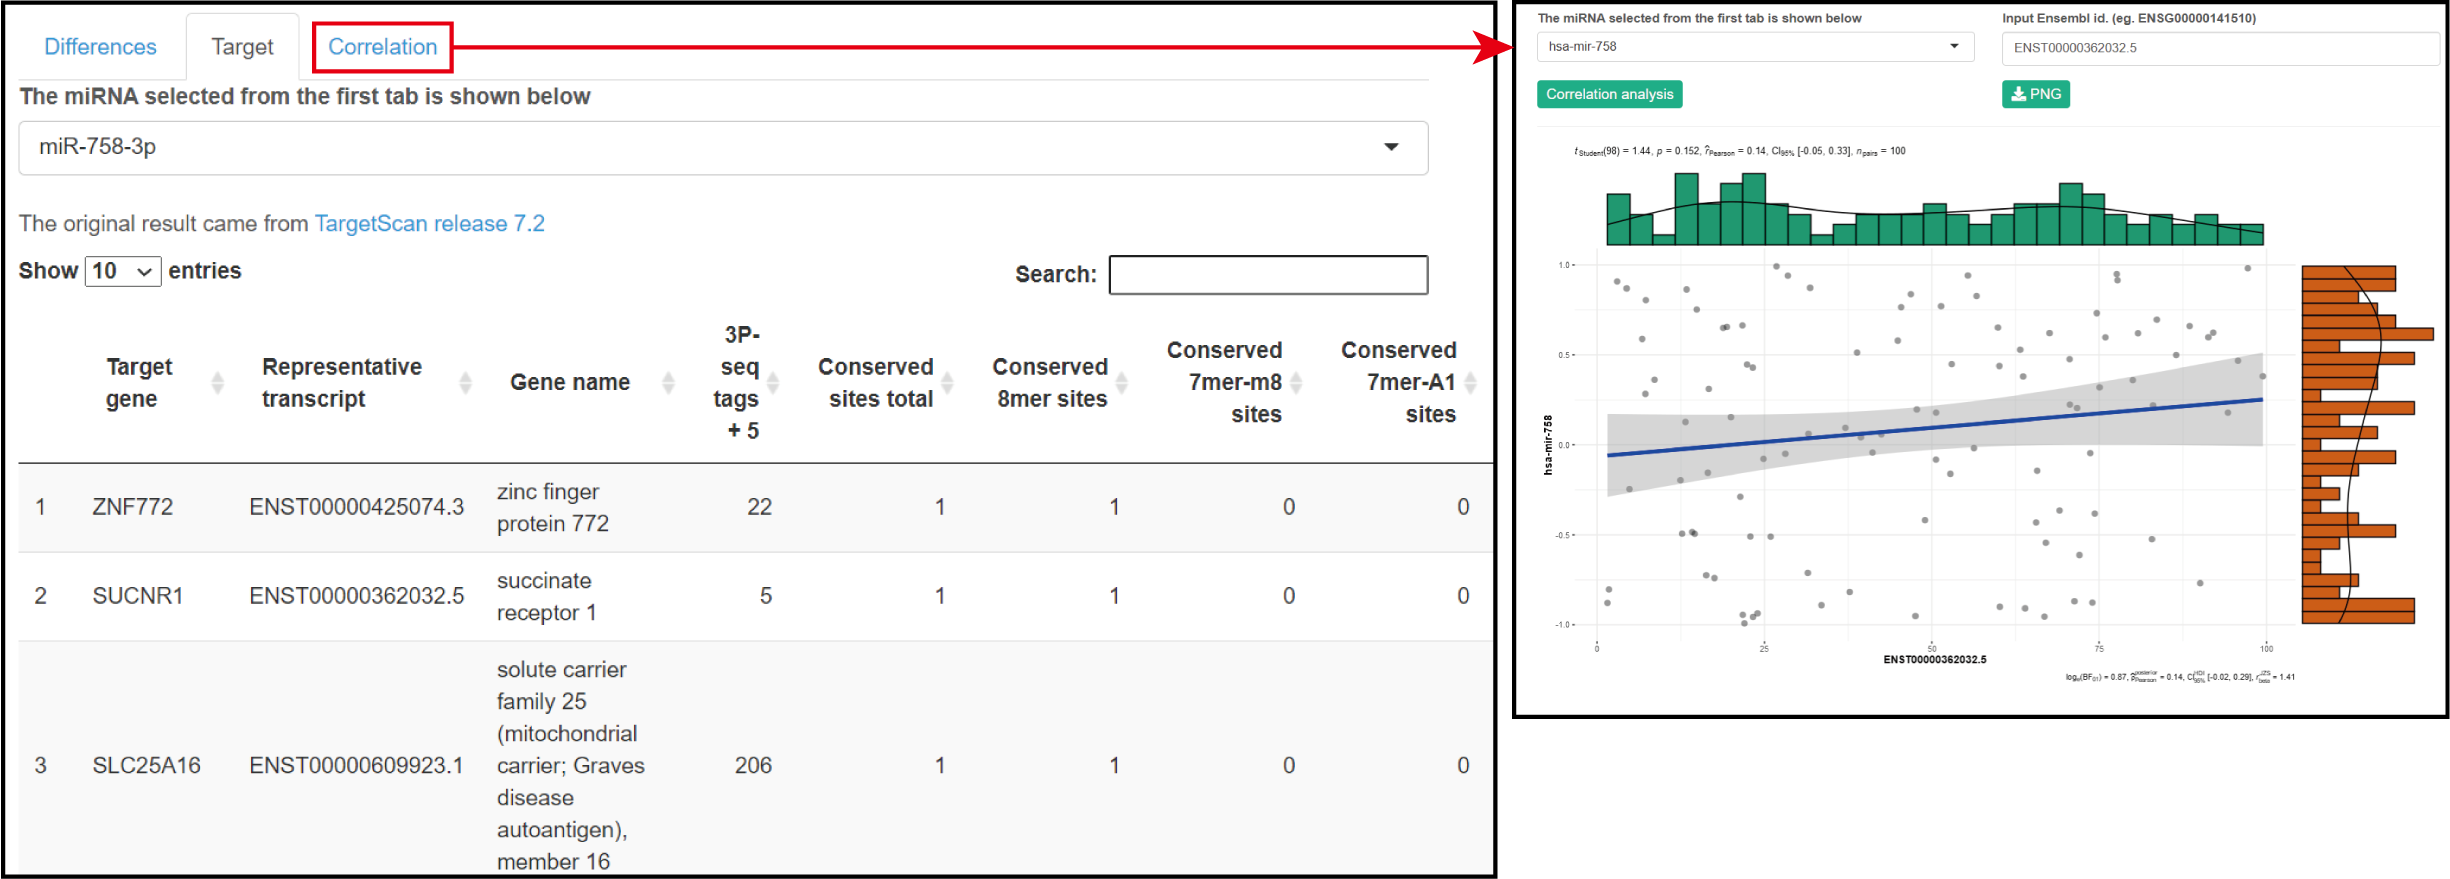
Parameters
Please refer to miRNA parameters.
Result
The predicted target genes are shown in the ranking list, and the Pearson correlation with the expression of target genes are shown as Scatter plot.
Signatures and pathways
Tumor microenvironment
Parameters
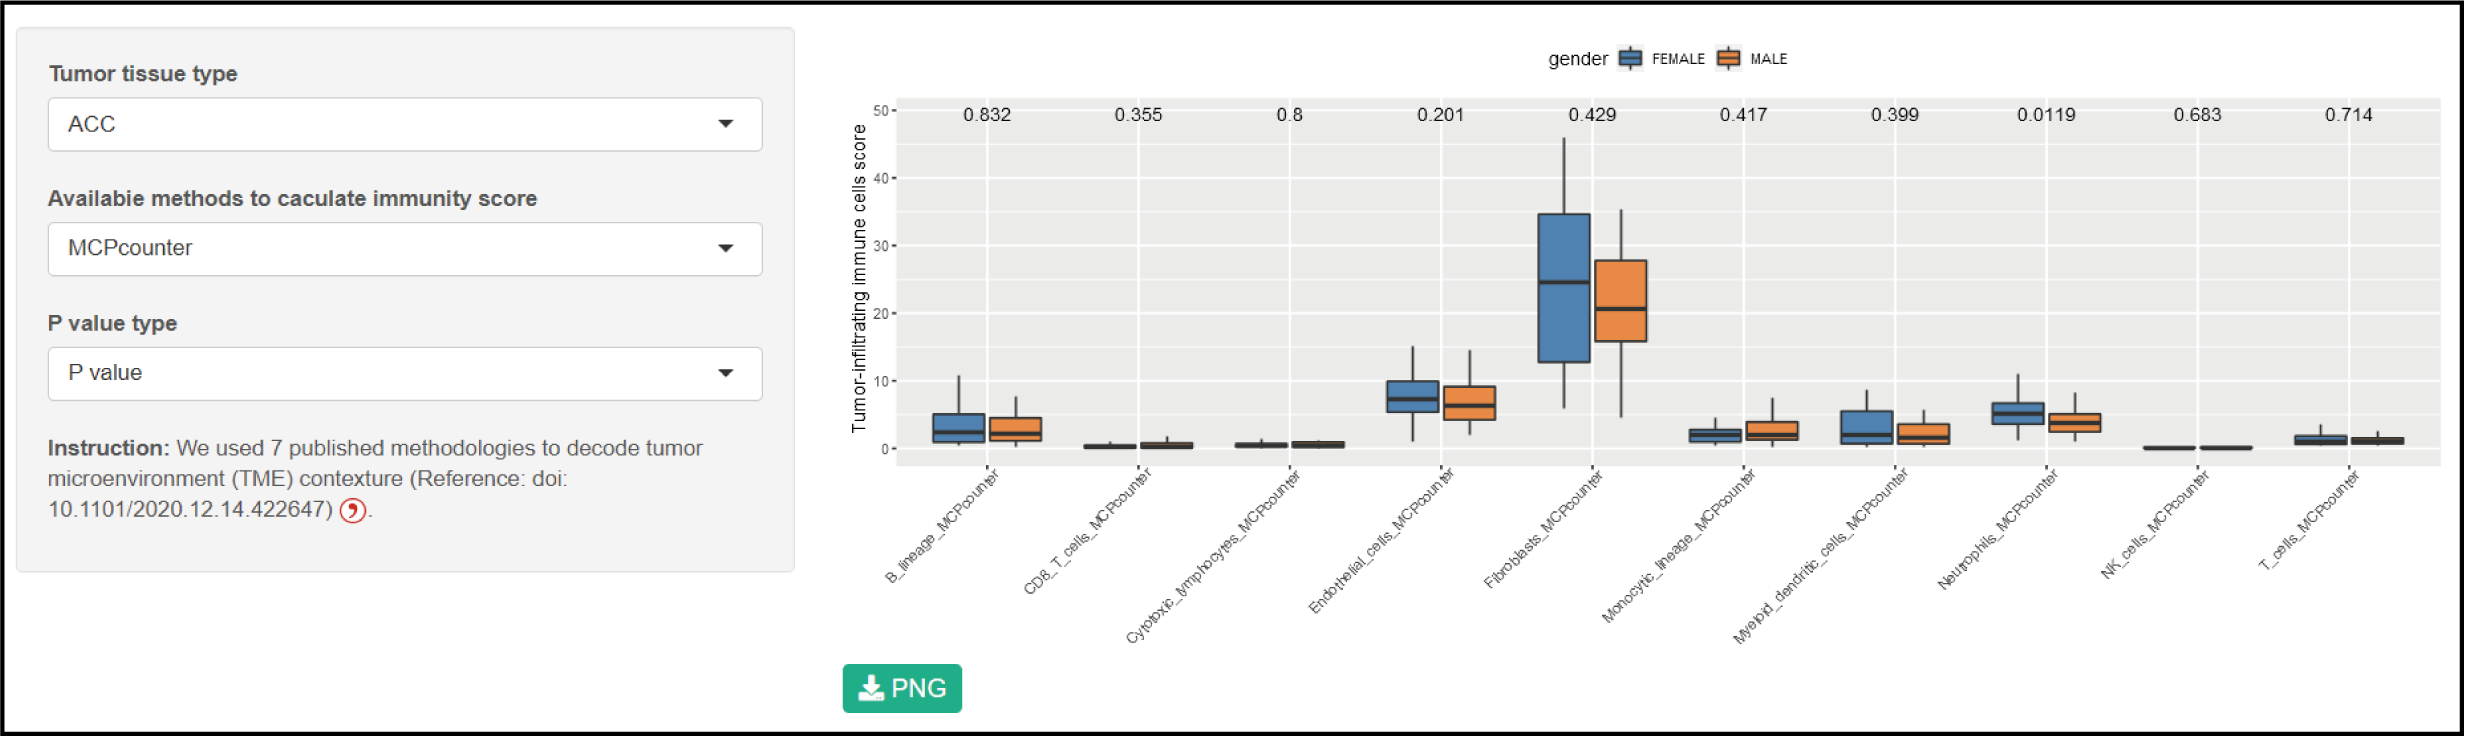
Tumor tissue type: TCGA code can been selcet.
Availabie methods to caculate immunity score: 7 published methodologies to decode tumor microenvironment.
P value type: P value or P symbol. *, p value < 0.05; **, p value < 0.01; ***, p value < 0.001; ****, p value < 0.0001.
Result
The significant difference in different immune cells between sexs were shown in a box plot.
Signatures
Parameters
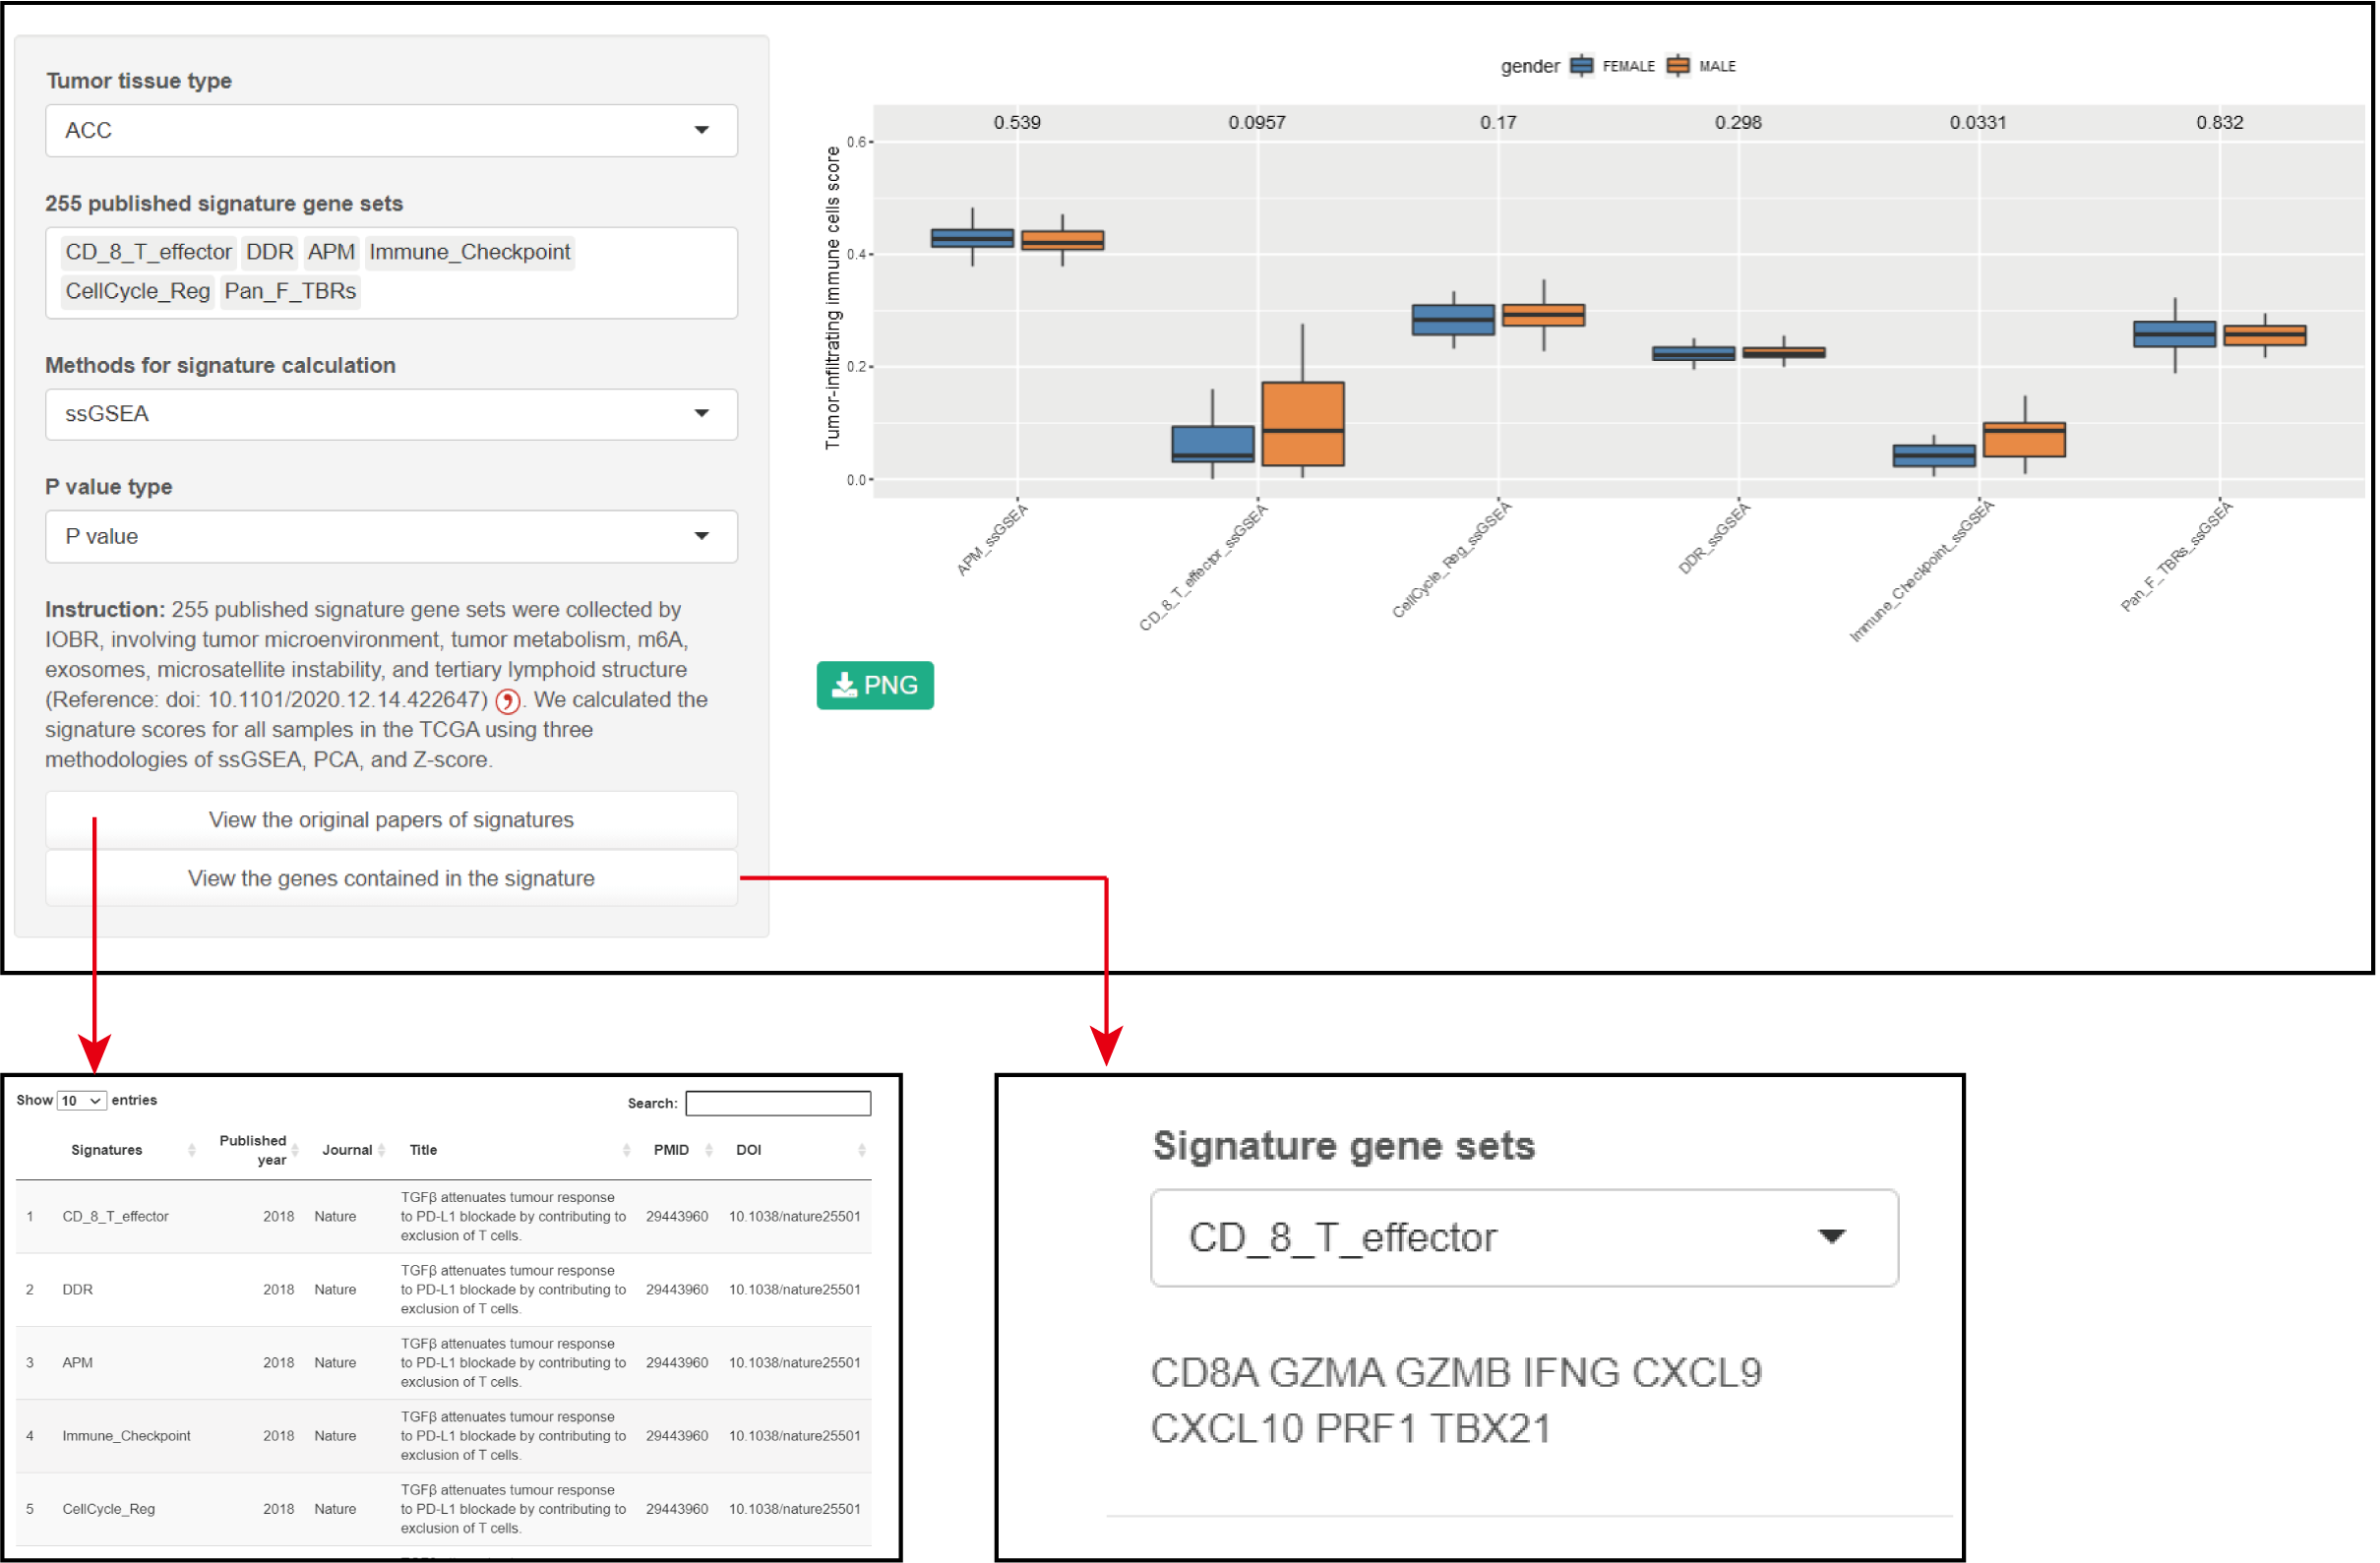
Tumor tissue type: TCGA code can been selcet.
255 published signature gene sets: 255 published signature gene sets.
Methods for signature calculation: ssGSEA, PCA or z-score.
Result
1. The significant difference in tumor-related signatures between the sexes were shown in a box plot.
2. Click the button to show the source of the signature and the genes it contains.
Therapy response
Chemotherapy response

Parameters
Dataset: CCLE1, GDSC1 or GDSC2.
Model: Drug/compound or target.
Result
The differences in drug/compound response between sexs were shown in a box plot or volcano Plot.
Cite us!
Long-Fei Zhao, Jin-Ge Zhang, Feng-Yu Qi, Wei-Yan Hou, Yin-Rui Li, Dan-Dan Shen, Li-Juan Zhao, Lin Qi, Hong-Min Liu, Yi-Chao Zheng, SDC: An integrated database for sex differencess in cancer, Computational and Structural Biotechnology Journal, Volume 20, 2022, Pages 1068-1076, ISSN 2001-0370, https://doi.org/10.1016/j.csbj.2022.02.023.
Contact:
Longfei Zhao: longfei8533@qq.com
Yichao Zheng: yichaozheng@zzu.edu.cn
Github
https://github.com/longfei8533/SDC/
Our lab
http://yichaozheng.cn
Acknowledgments
We thank The Cancer Genome Atlas (TCGA), Genotype-Tissue Expression Project (GTEx), UCSC Xena, Broad Institute Cancer Cell Line Encyclopedia (CCLE), and Genomics of Drug Sensitivity in Cancer (GDSC) teams.